Call Our Office
(559) 384-2900 | Fresno
(619) 480-1413 | San Diego
(619) 480-1413 | San Diego
Your Money
Your Life
Your Way
You are now leaving the Strong Valley Wealth & Pension, LLC ("Strong Valley") website. By clicking on the "Schwab Alliance Access" link below you will be entering the Charles Schwab & Co., Inc. (“Schwab”) Website. Schwab is a registered broker-dealer, and is not affiliated with Strong Valley or any advisor(s) whose name(s) appears on this Website. Strong Valley is/are independently owned and operated. Schwab neither endorses nor recommends Strong Valley. Regardless of any referral or recommendation, Schwab does not endorse or recommend the investment strategy of any advisor. Schwab has agreements with Strong Valley under which Schwab provides Strong Valley with services related to your account. Schwab does not review the Strong Valley website(s), and makes no representation regarding the content of the Website(s). The information contained in the Strong Valley website should not be considered to be either a recommendation by Schwab or a solicitation of any offer to purchase or sell any securities.
Every four years, Washington D.C. and Wall Street converge as Americans elect a president and Wall Street tries to figure out what the outcome means for the stock and bond markets. And since so many hypotheses on this topic abound, it’s hard to keep track of them all. In Part IV of this series – this new list includes a couple of recent presidents that you know much more about as well as the beginning of presidencies recording double-digit annual stock market returns.
Every four years, Washington D.C. and Wall Street converge as Americans elect a president and Wall Street tries to figure out what the outcome means for the stock and bond markets. And since so many hypotheses on this topic abound, it’s hard to keep track of them all.
For example, there are those who swear that Wall Street performs better when:
But what if we ranked the best and worst presidents simply by the performance of the stock market? Surely that would settle the debate as to which president was best for investors, right? Well, while it sounds easy – and the editors at Kiplinger did rank presidents from worst to best according to the stock market – there are a few big caveats to consider.
Caveat #1: Since the Office of the President was established in 1789, America has had 44 different presidents. And just three years later, Wall Street was officially founded on May 17, 1792 with the signing of the Buttonwood Agreement.
But for the most part, there really was no “stock market” until the late 1800s, meaning it doesn’t make sense to include the first 22 presidents. So this analysis starts with the election of 1888.
Caveat #2. The Dow Jones Industrial Average was first published on May 26, 1896 and it followed the 12 largest companies in each sector. Today, it tracks 30 companies. The other very commonly-used index – the S&P 500 – although introduced in 1957 it does track data back to the late 1920s. The editors of Kiplinger decided to use the S&P 500 from President Hoover to the present and the DJIA for earlier.
Caveat #3. Returns do not include dividends. Over the last few decades, dividends have become a smaller component of total returns, so not including dividends will tend to favor more recent presidents.
Caveat #4. Data is not adjusted for inflation. This will tend to help presidents of inflationary times (Carter and Ford) and hurt presidents of deflationary times (Hoover and Bush).
Final Caveat. This one is sure to spark heated debate, but it seems fair to not include President Trump on this list simply because his presidency is still going.
Parts I, III and III brought us this list:
#1: President Herbert Hoover (-30.8% per year)
#2: President George W. Bush (-5.6% per year)
#3: President Grover Cleveland (-4.9% per year)
#4: President Richard Nixon (-3.9% per year)
#5: President Benjamin Harrison (-1.4% per year)
#6: President William Howard Taft (-0.1% per year)
#7: President Theodore Roosevelt (2.2% per year)
#8: President Woodrow Wilson (3.1% per year)
#9: President Franklin Roosevelt (6.2% per year)
#10: President John Kennedy (6.5% per year)
#11: President Jimmy Carter (6.9% per year)
#12: President Warren Harding (6.9% per year)
#13 of 22
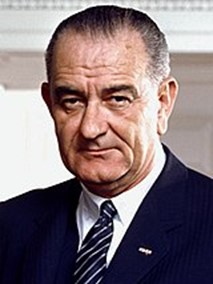
President Lyndon B. Johnson, Democrat
President Lyndon B. Johnson – also known as LBJ – assumed the presidency following the assassination of President Kennedy. His presidency is most often remembered for the escalation of the Vietnam War and significant social unrest throughout the country.
LBJ is generally ranked favorably by many economic historians for his domestic policies, including his War on Poverty efforts, expansion of civil rights, and the establishment of Medicare and Medicaid.
While the stock market turned in a healthy 7.7% per year, the cost of the Vietnam War caused inflation to move higher, eventually leading to the stagflation (high inflation, low growth, high unemployment) periods that plagued the presidencies after LBJ’s.
#14 of 22
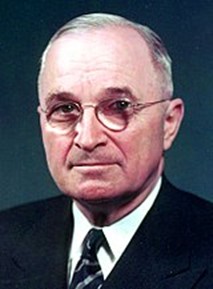
President Harry S. Truman, Democrat
President Truman ascended to the presidency after the death of President Franklin Roosevelt and is best known for ending World War II, dropping the atomic bombs on Hiroshima and Nagasaki, the Marshall Plan which helped rebuild Western Europe and leading the U.S. into the Korean War.
Domestically, Truman’s presidency oversaw the start of the post-World War II surge in U.S. prosperity, although it was not without challenges, especially as Truman’s presidency was pockmarked with union strikes and rising consumer prices, leading to higher inflation.
Nevertheless, stocks averaged an 8.1% annual return during the Truman years.
#15 of 22
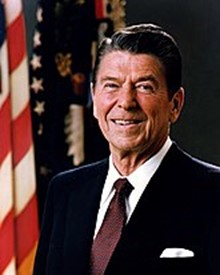
President Ronald Reagan, Republican
A 1983 cover article in Time Magazine emblazoned with the headline: The New Economy helps describe the time during Reagan’s presidency – as the economy transitioned from industrial to technology as one of the greatest bull markets in history took root.
One of Reagan’s economic pillars invokes passionate debate as “Reaganomics” and its corresponding tax cuts, deregulation, less government spending and pro-business policies is healthily debated among economists.
Reagan came into office with inflation running high and his Fed Chair Paul Volker is generally credited with taming inflation with tight monetary policy. The resulting policies helped reduce inflation from 12.5% to 4.4% and bring real GDP to an annual growth rate of 3.6%.
When he left office in 1989, his approval rating was 68%, among the highest of any president. And his 10.2% annualized returns during his presidency surely had something to do with that.
#16 of 22
President Gerald Ford, Republican
President Ford was never actually elected Vice President or President, as he took over as vice president for the resigning Spiro Agnew and later took over when President Nixon resigned.
Generally regarded as a middle-of-the-pack president, President Ford took over during high inflation and slow growth times and at the tail-end of the punishing 1973-1974 bear market which pushed the S&P 500 and DJIA to drop by about half.
Economic historians generally credit the very respectable 10.8% annualized market returns during the Ford years more in part to the fact that the market was coming off of a low position versus anything President Ford did or didn’t do.
Next week will bring Part V and the list will include more presidents that you know and showcase presidencies recording enviable annual stock market returns.