Call Our Office
(559) 384-2900 | Fresno
(619) 480-1413 | San Diego
Your Money
Your Life
Your Way
Article

Longest Bond Bear Market

Longest Bond Bear Market

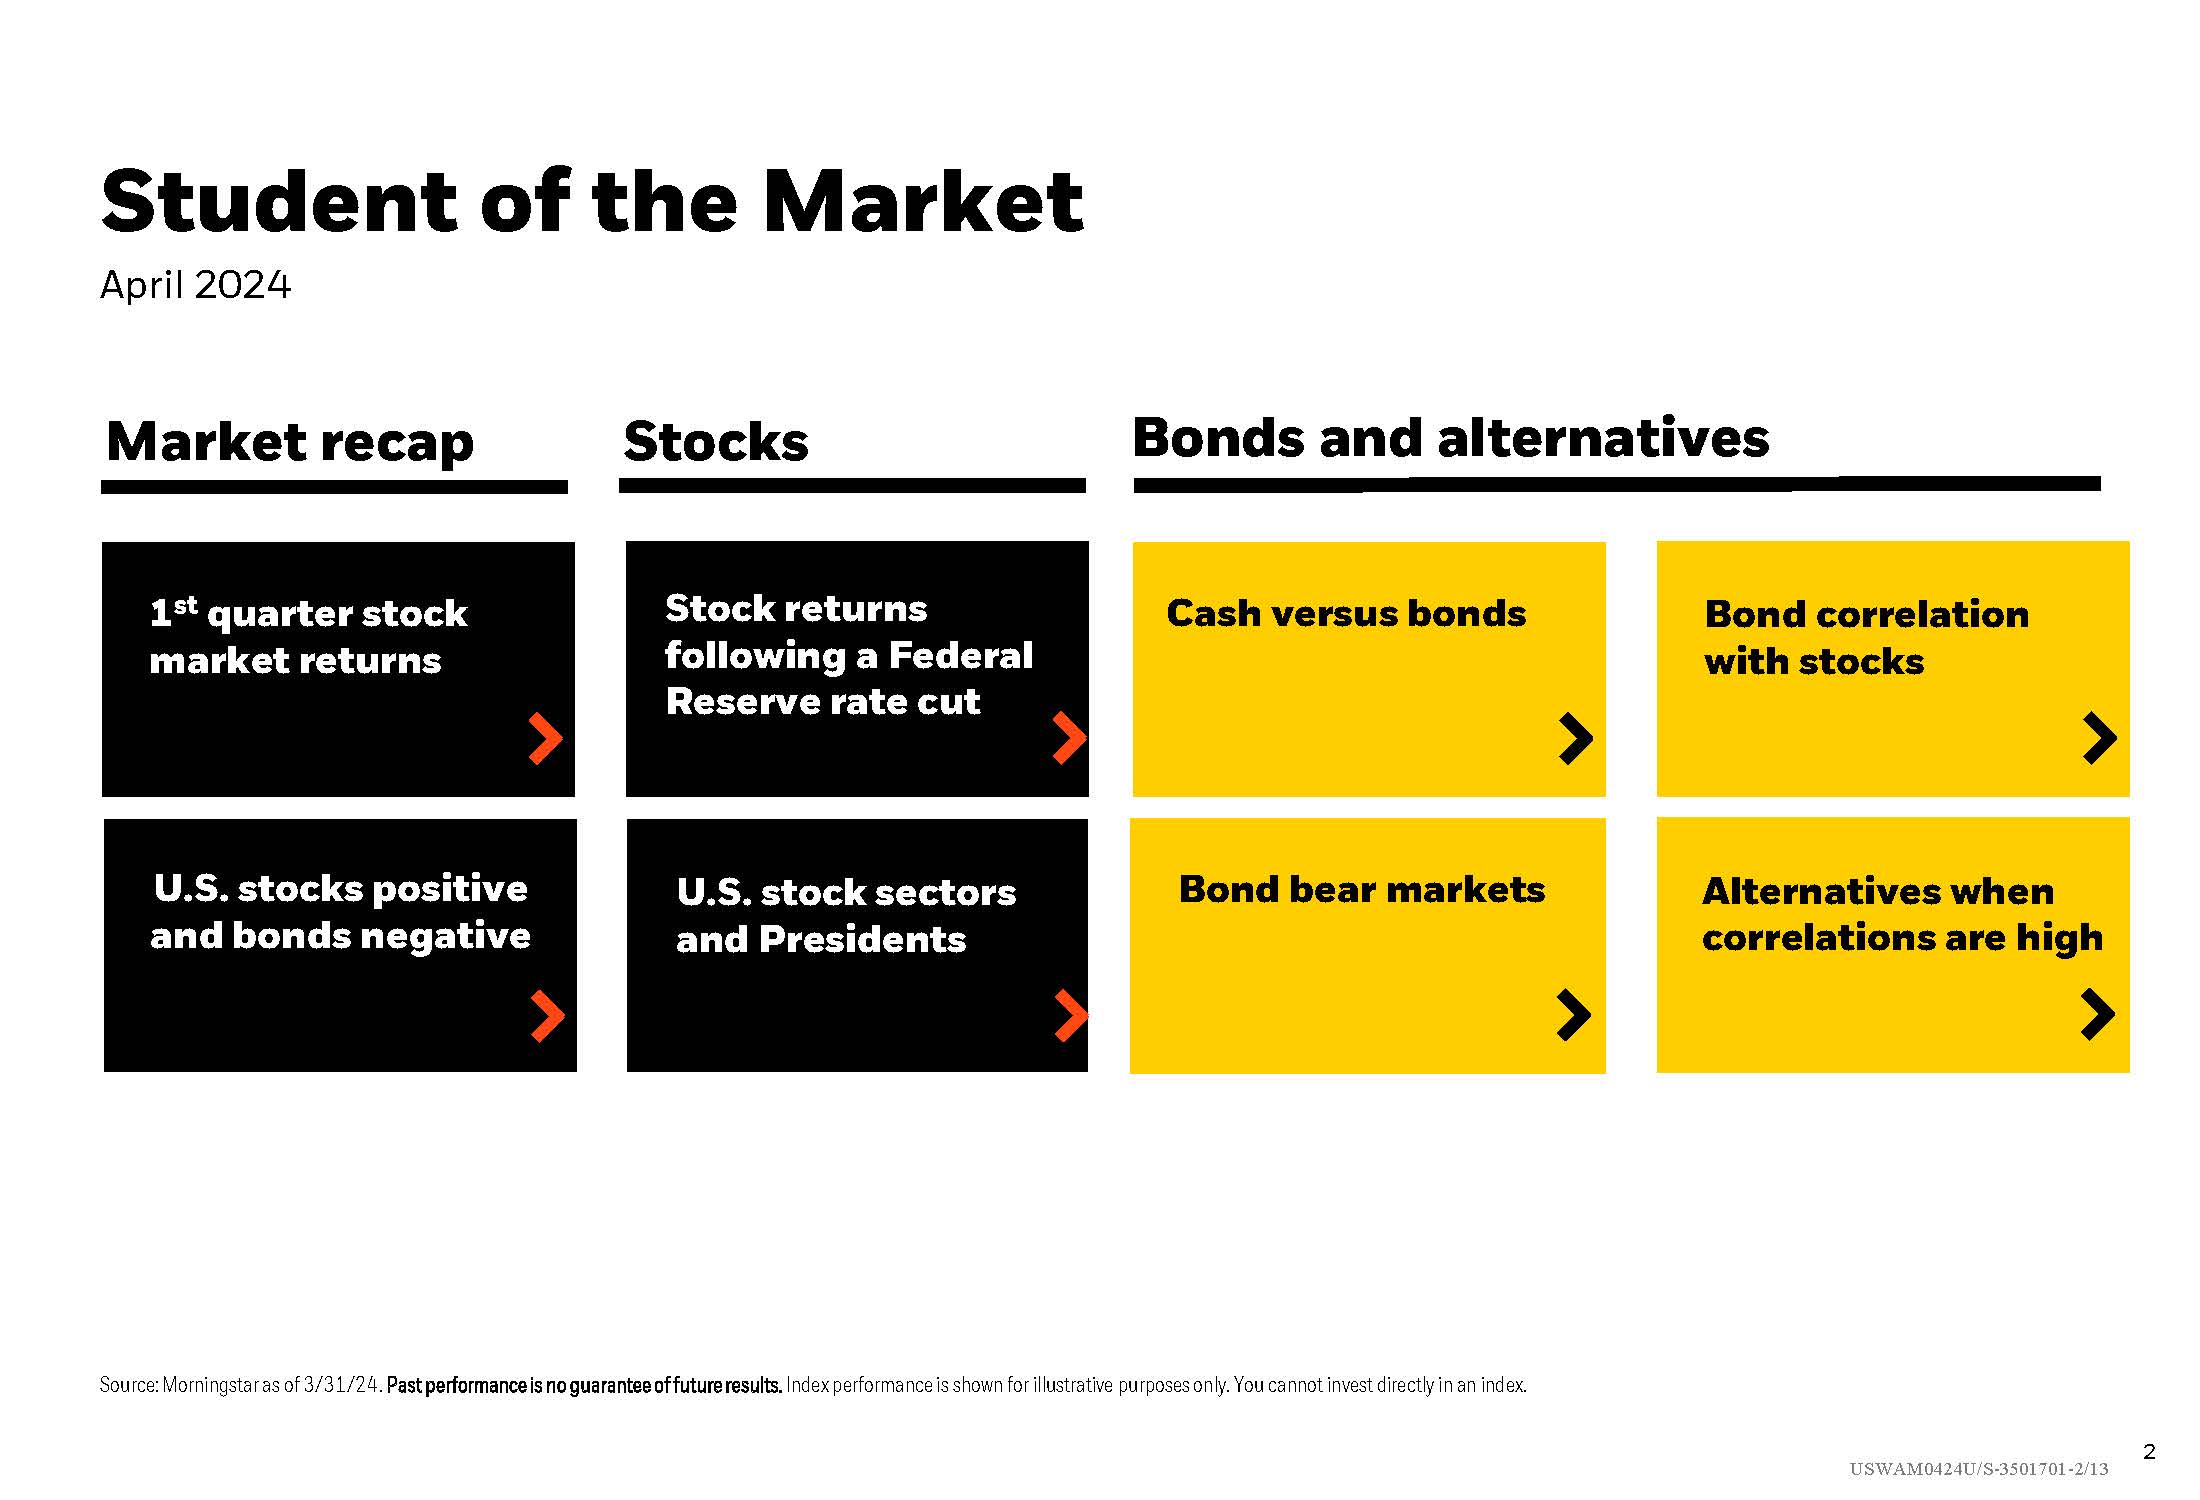
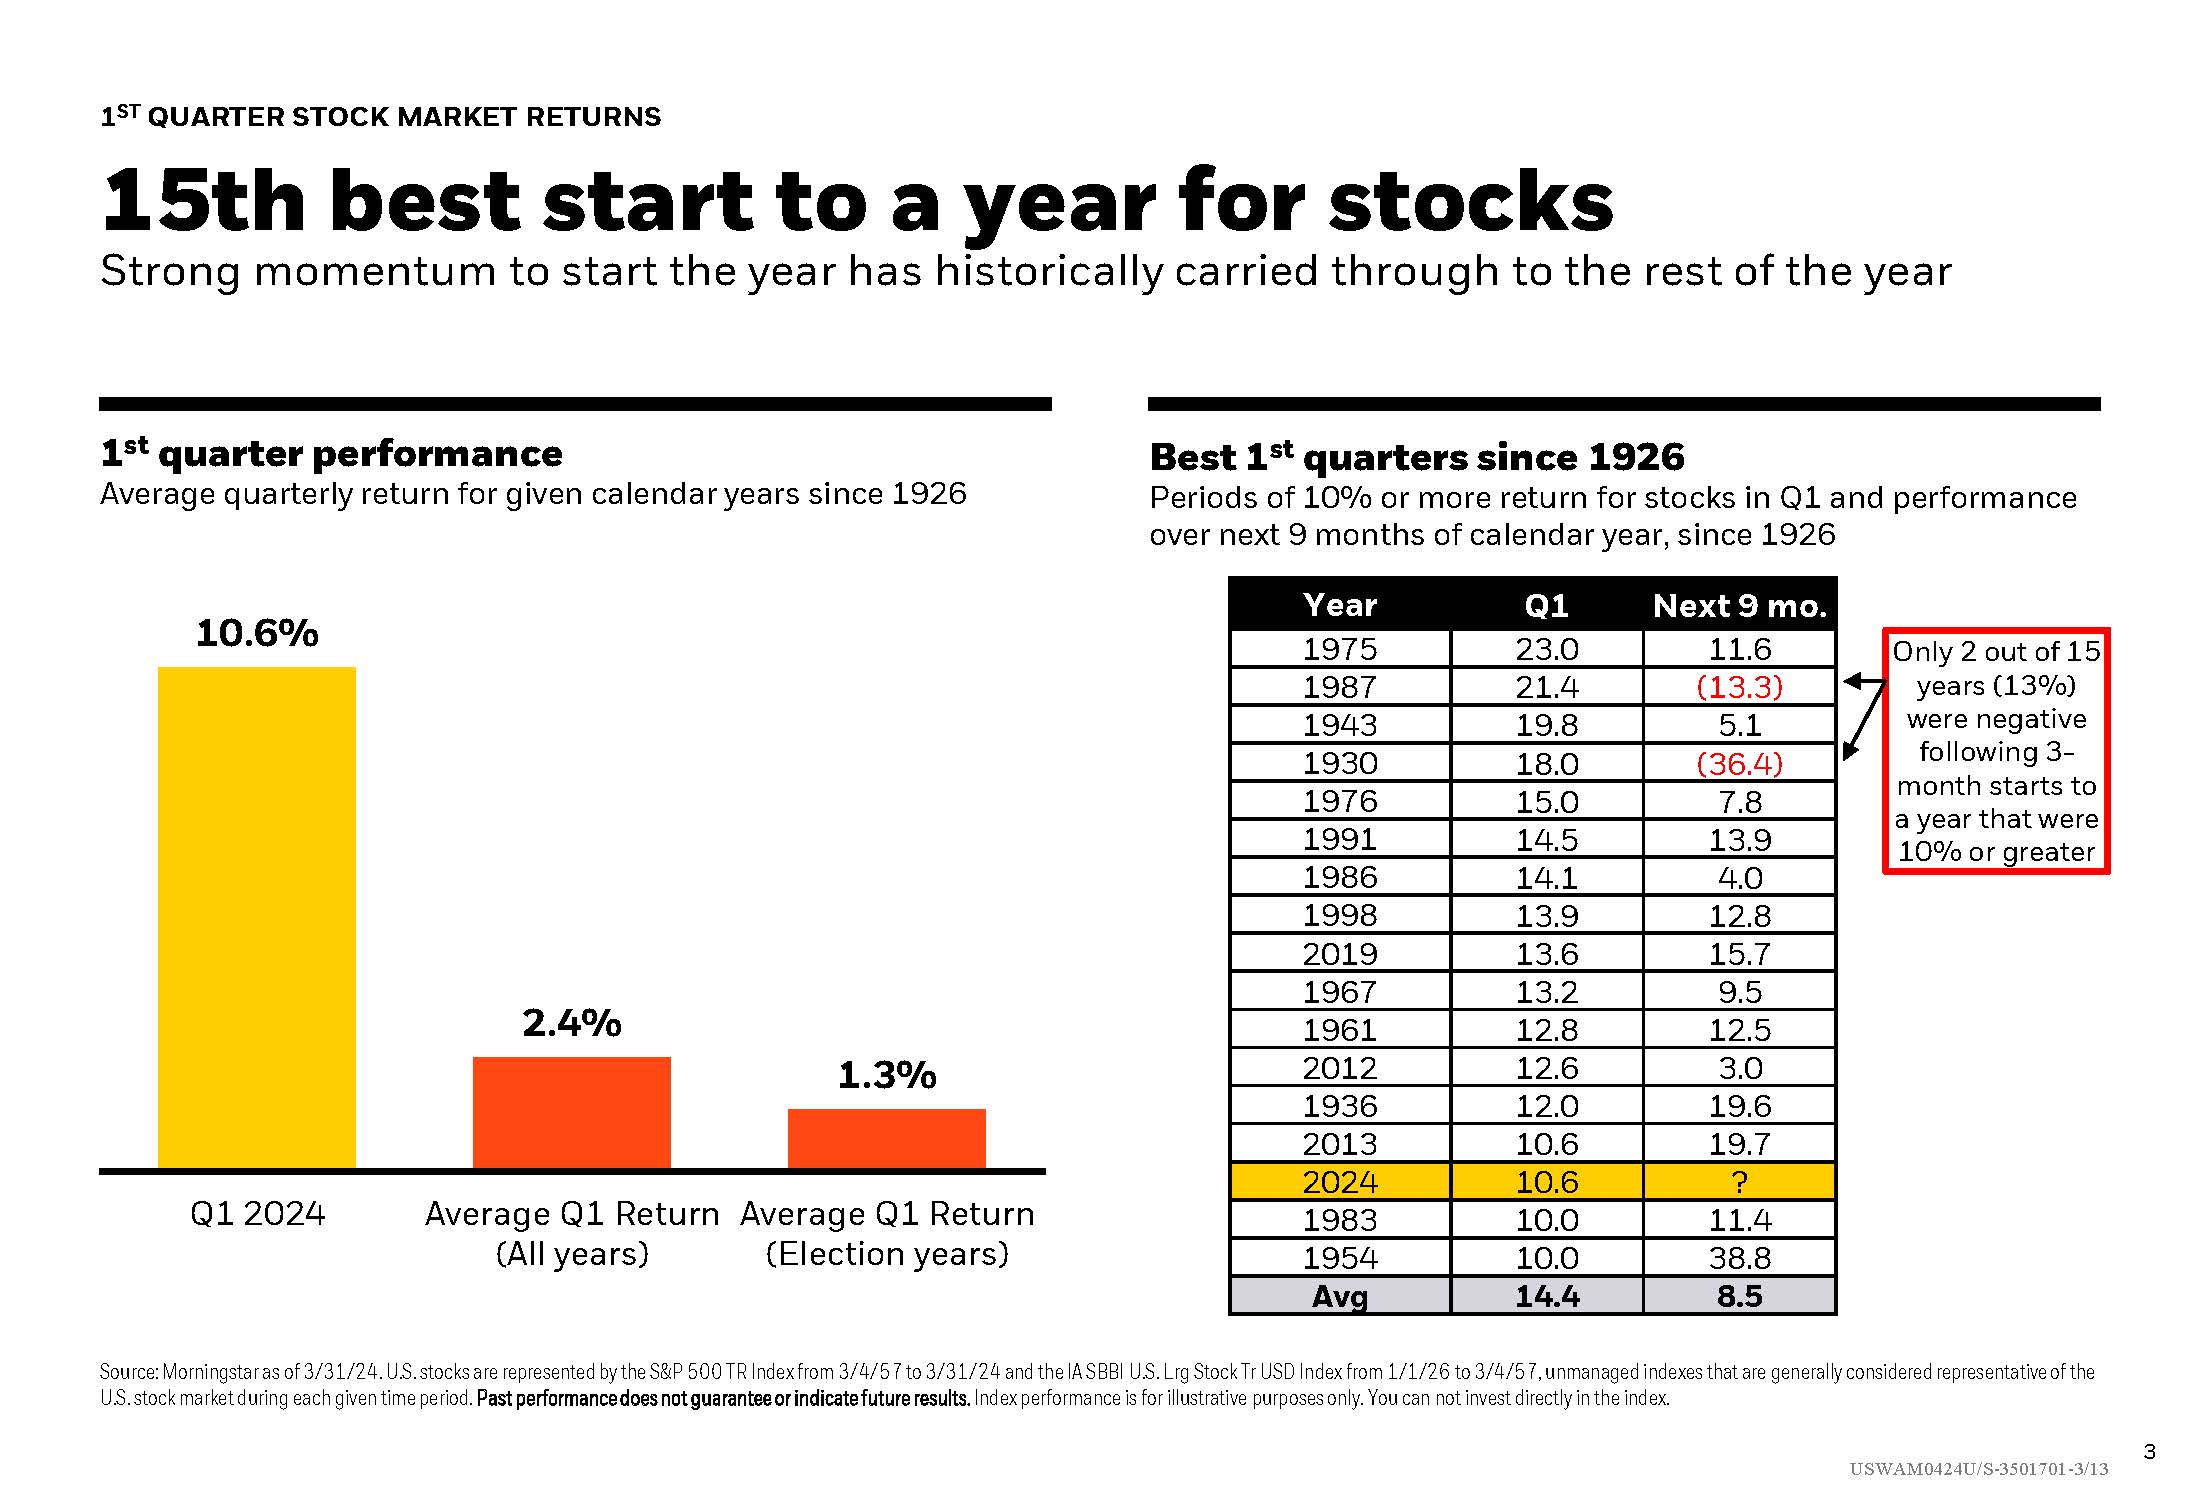
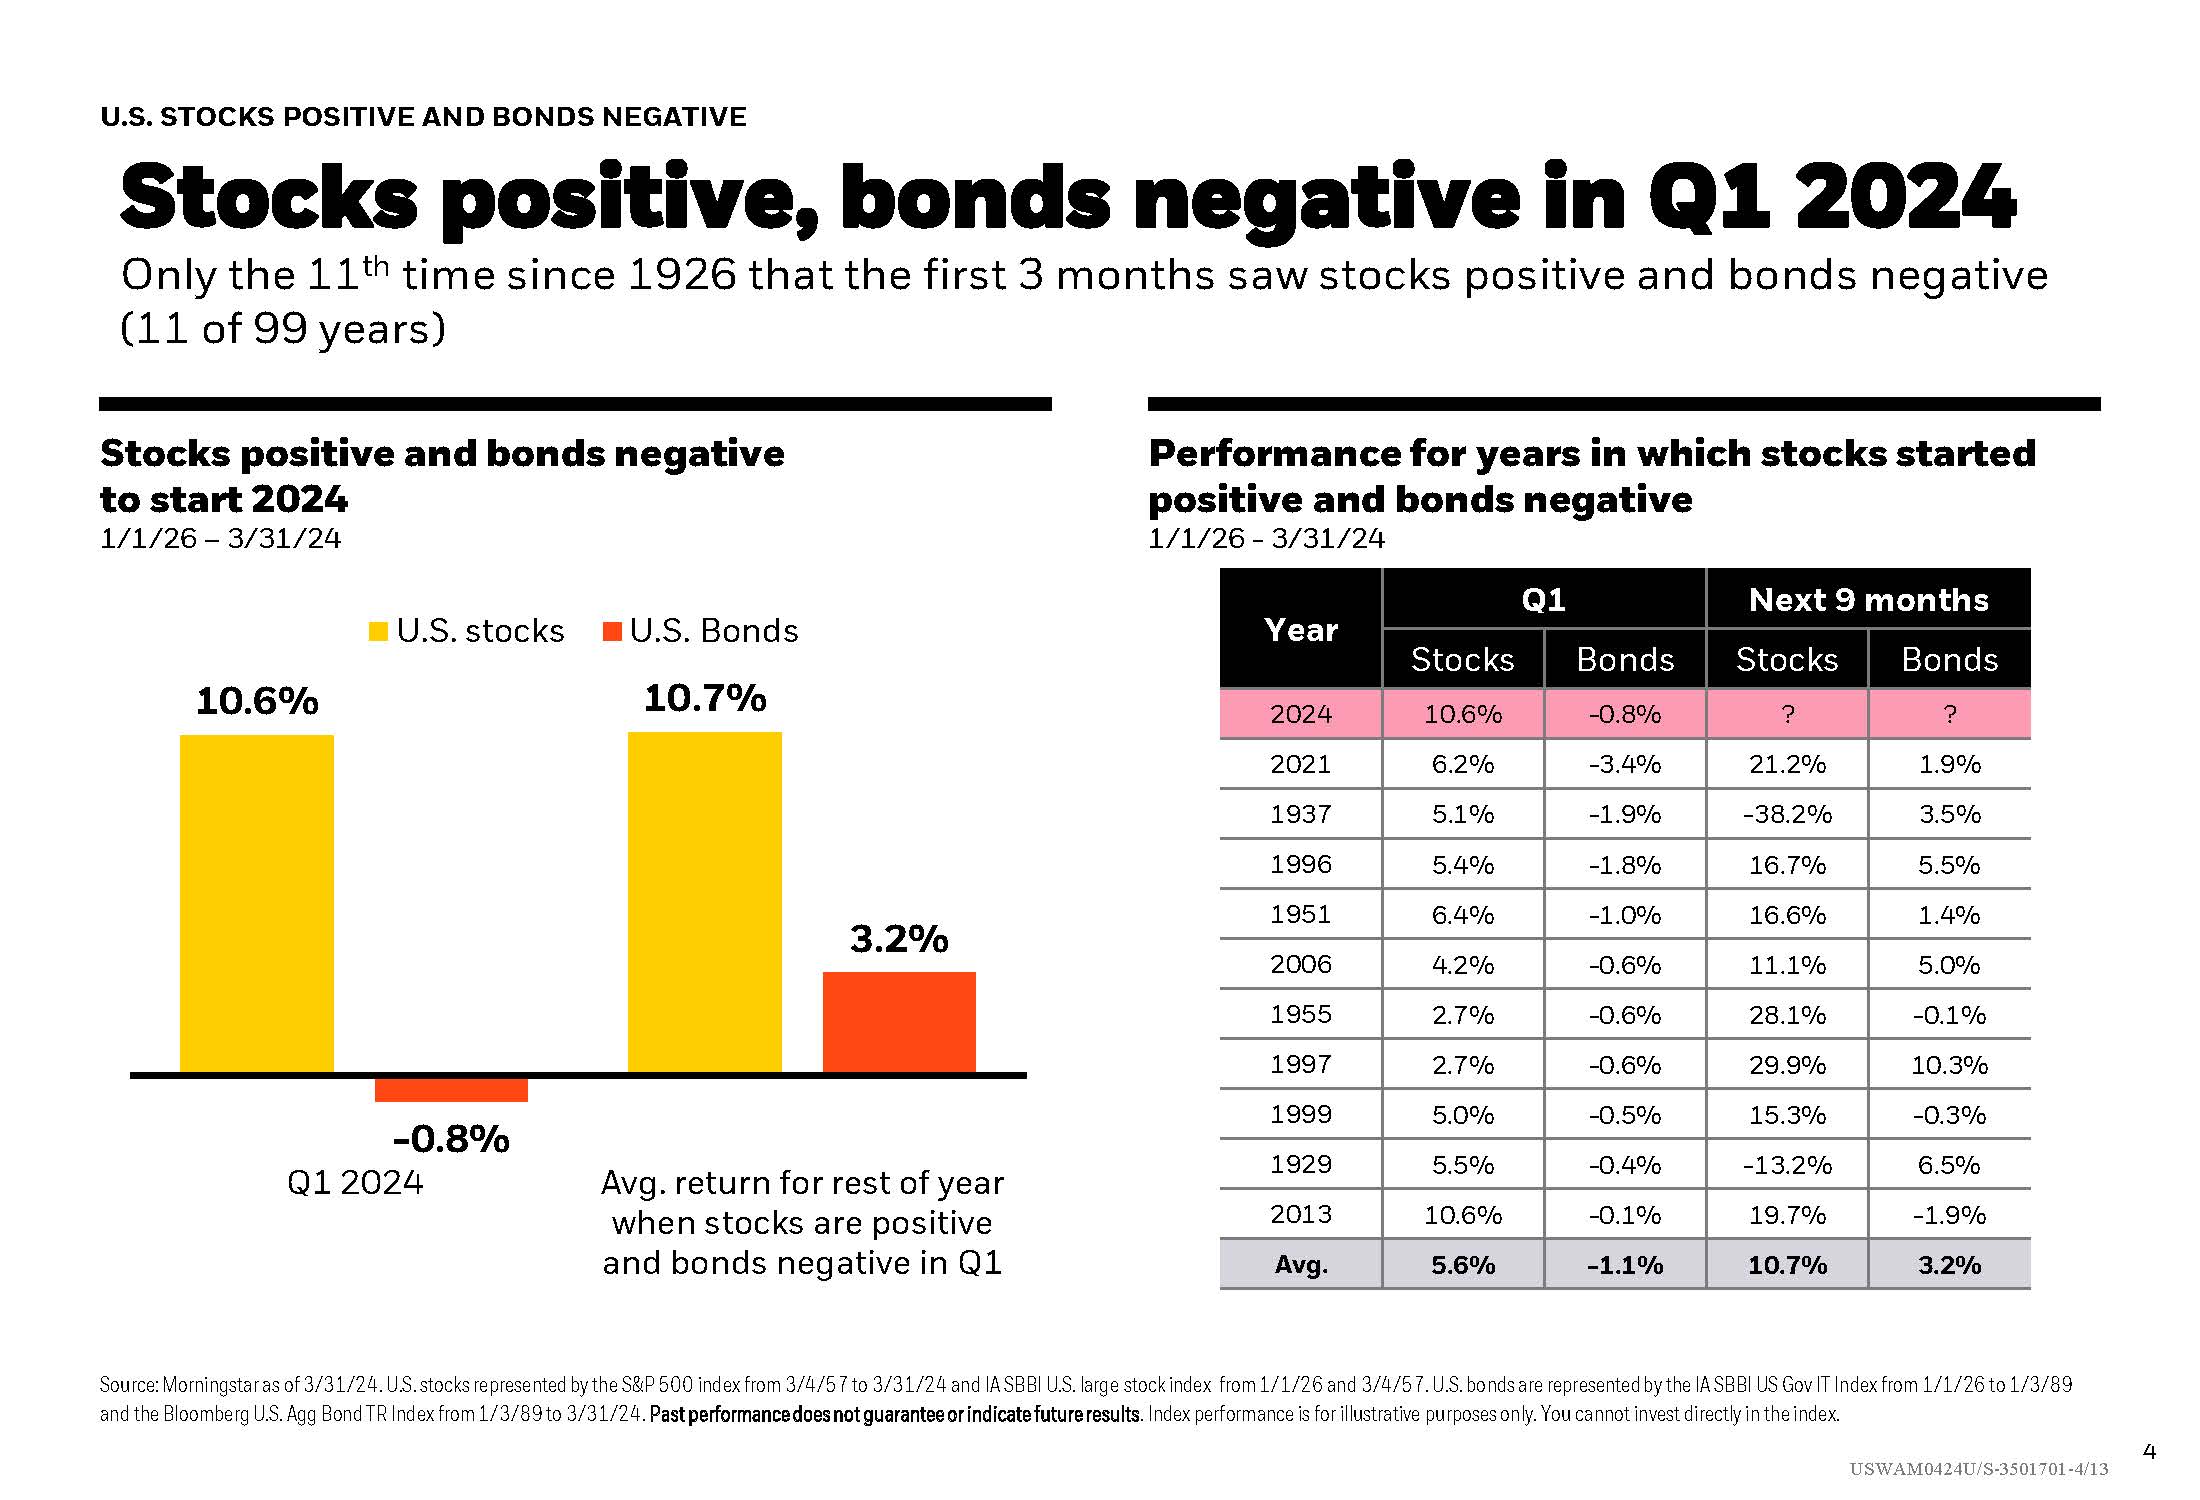
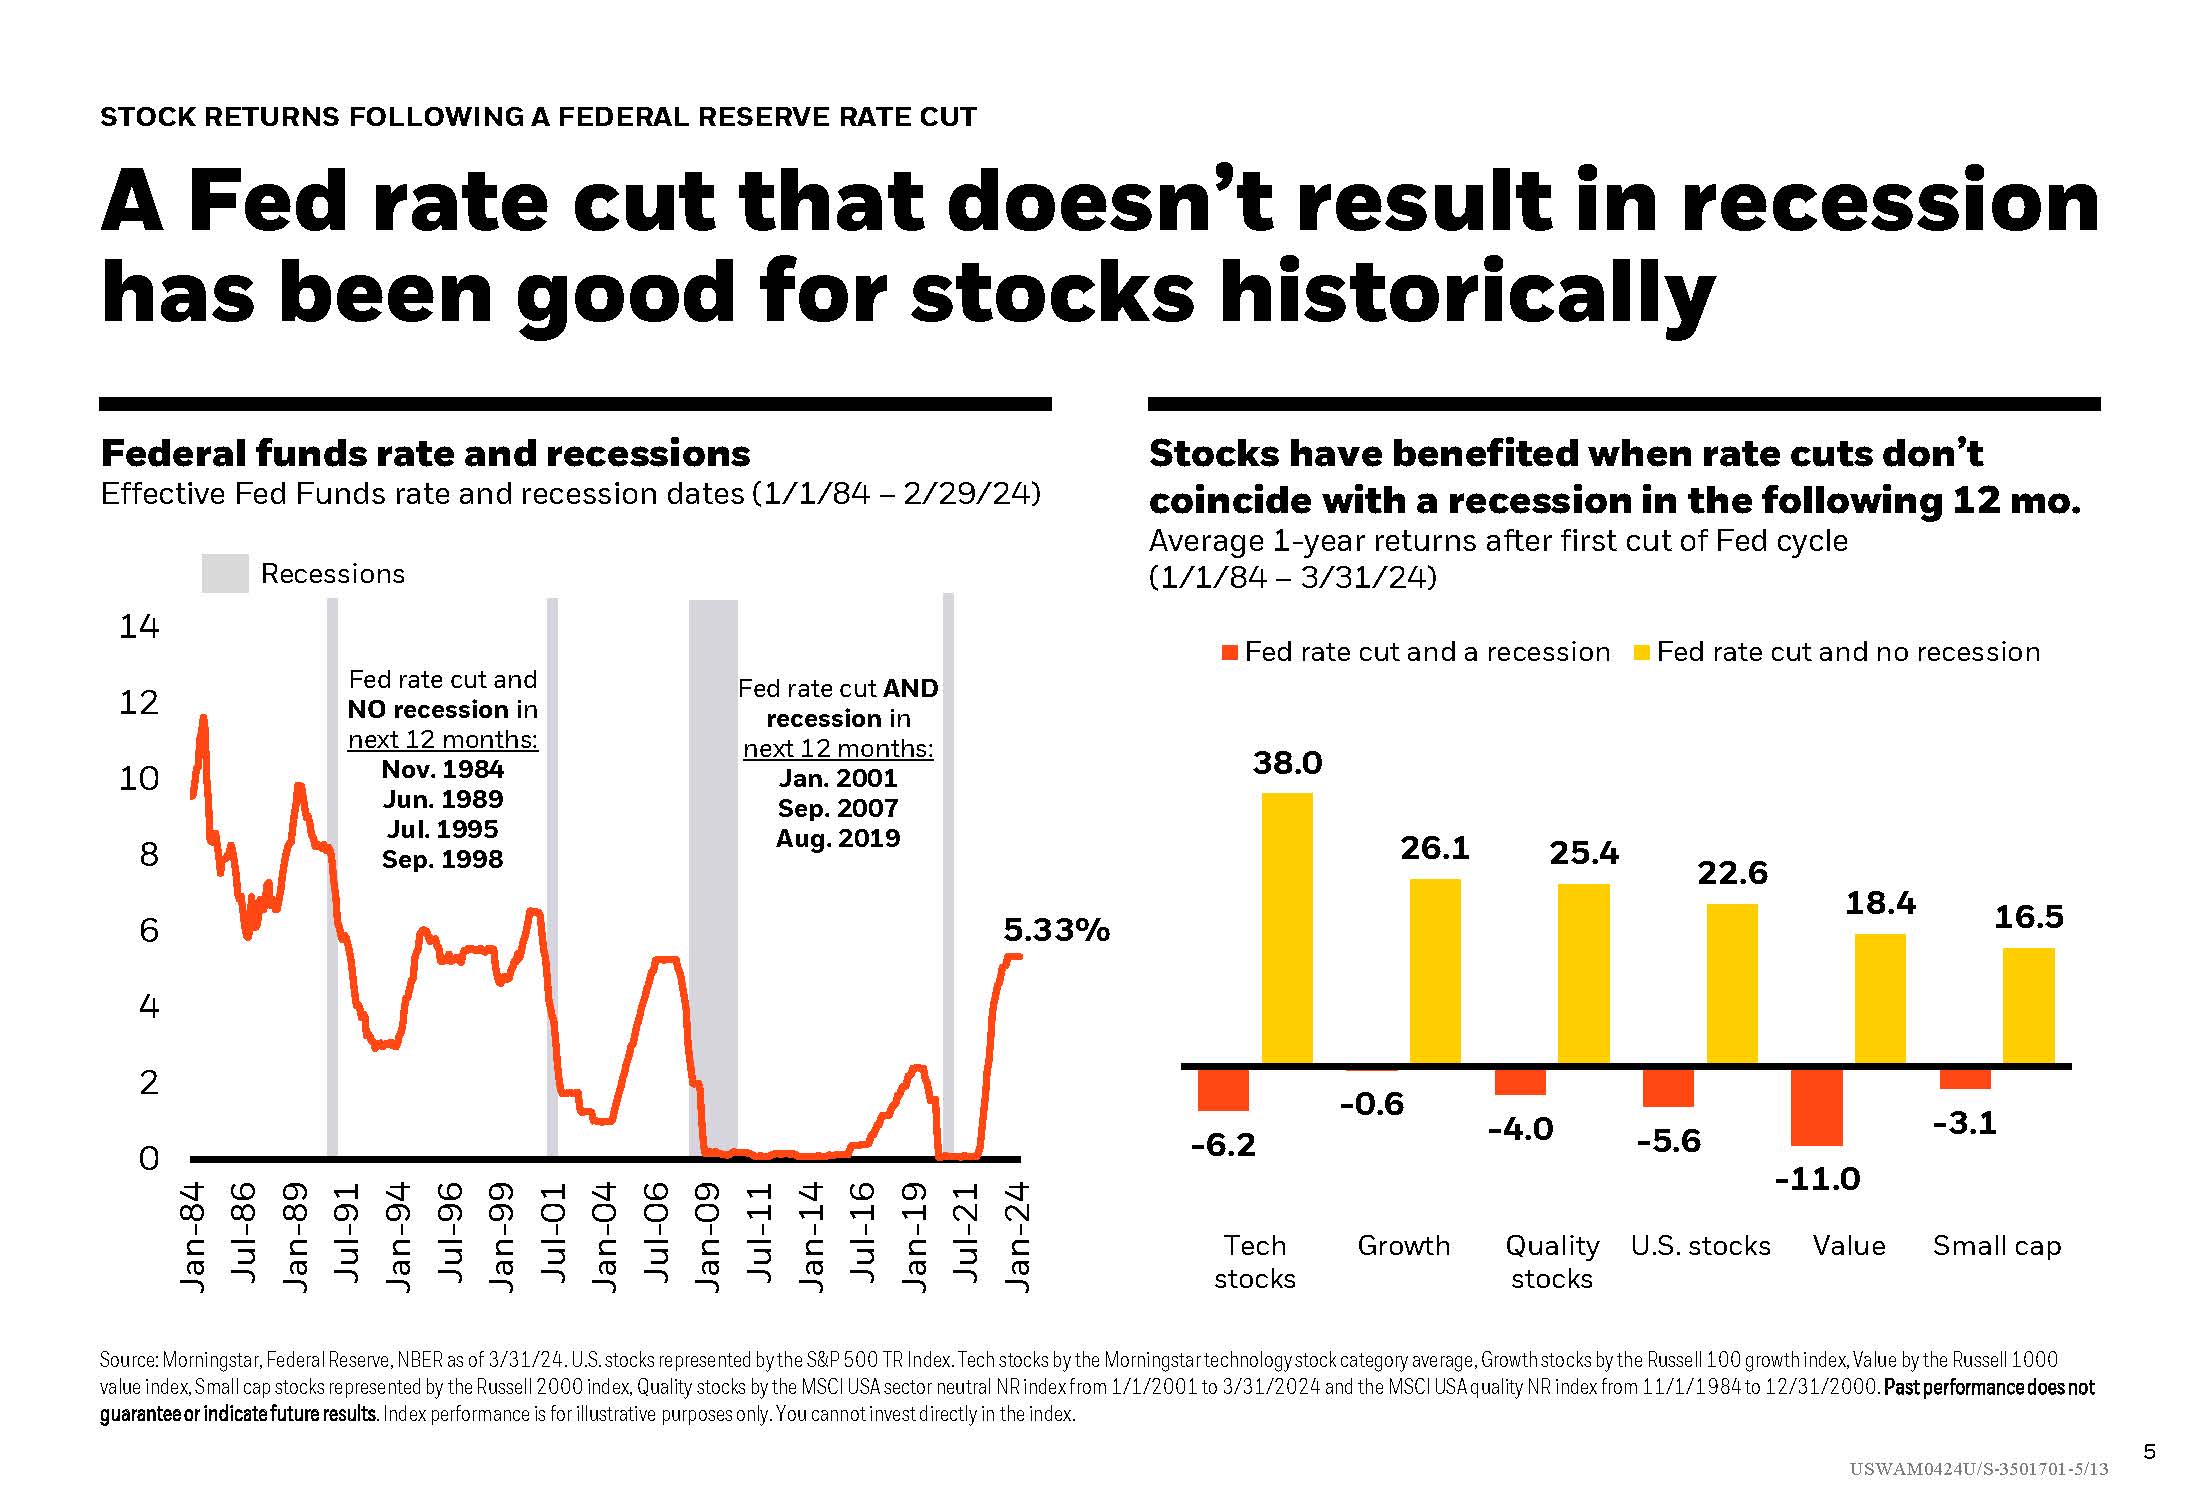
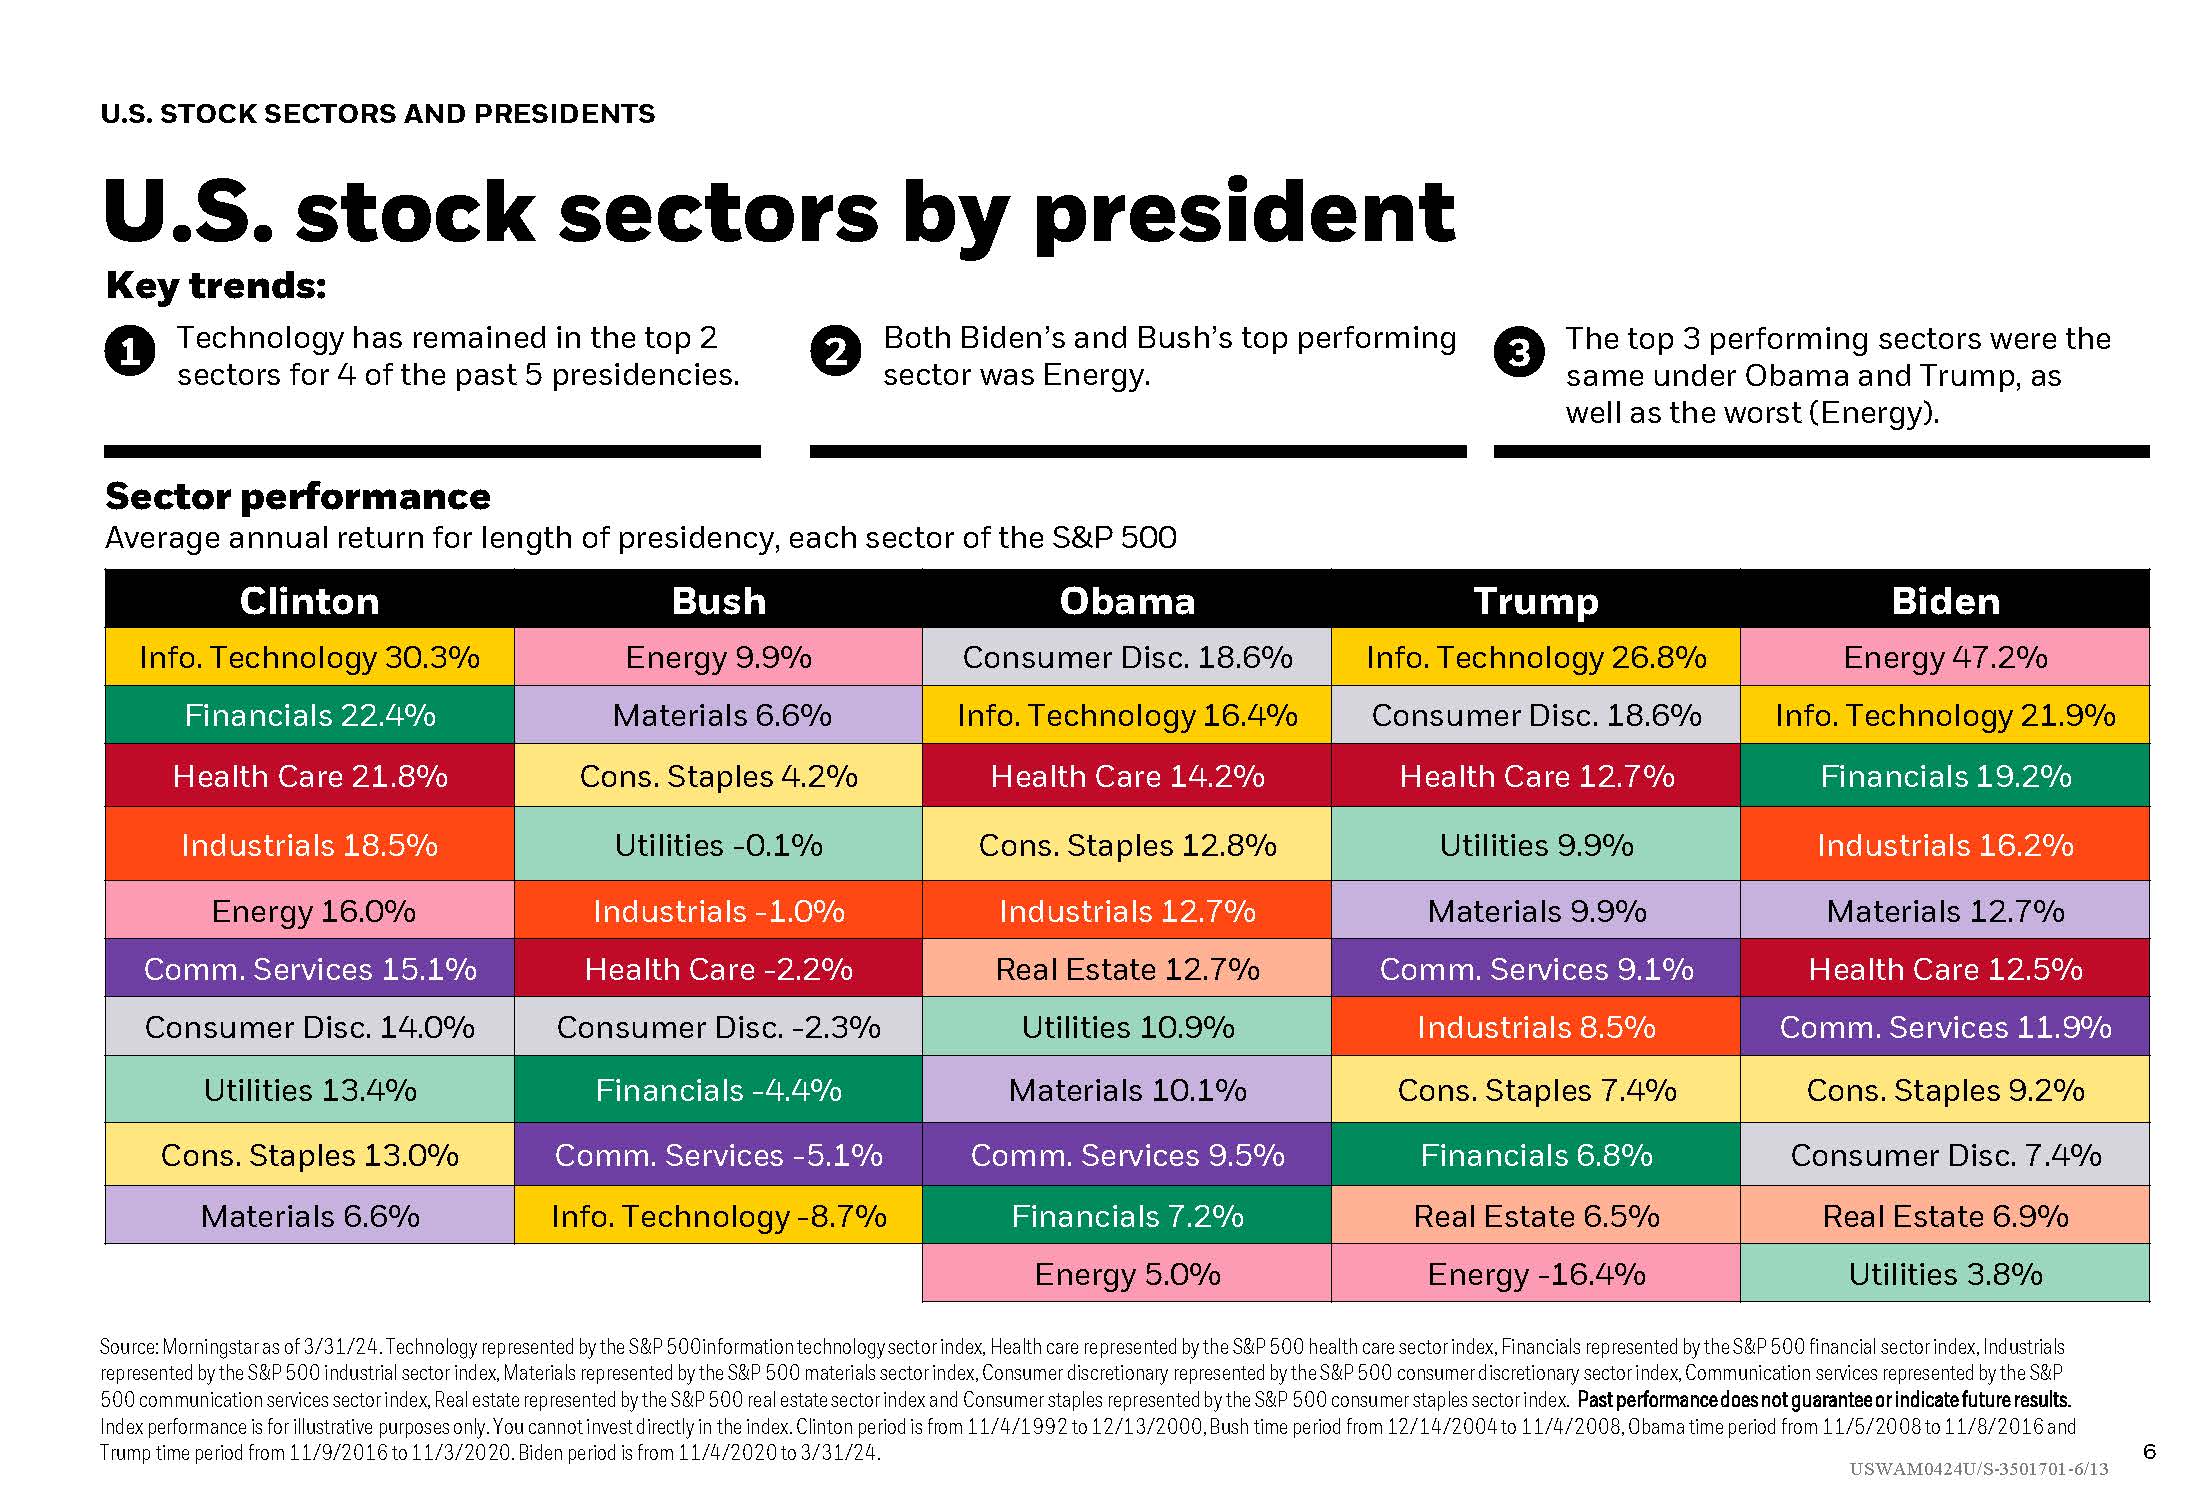
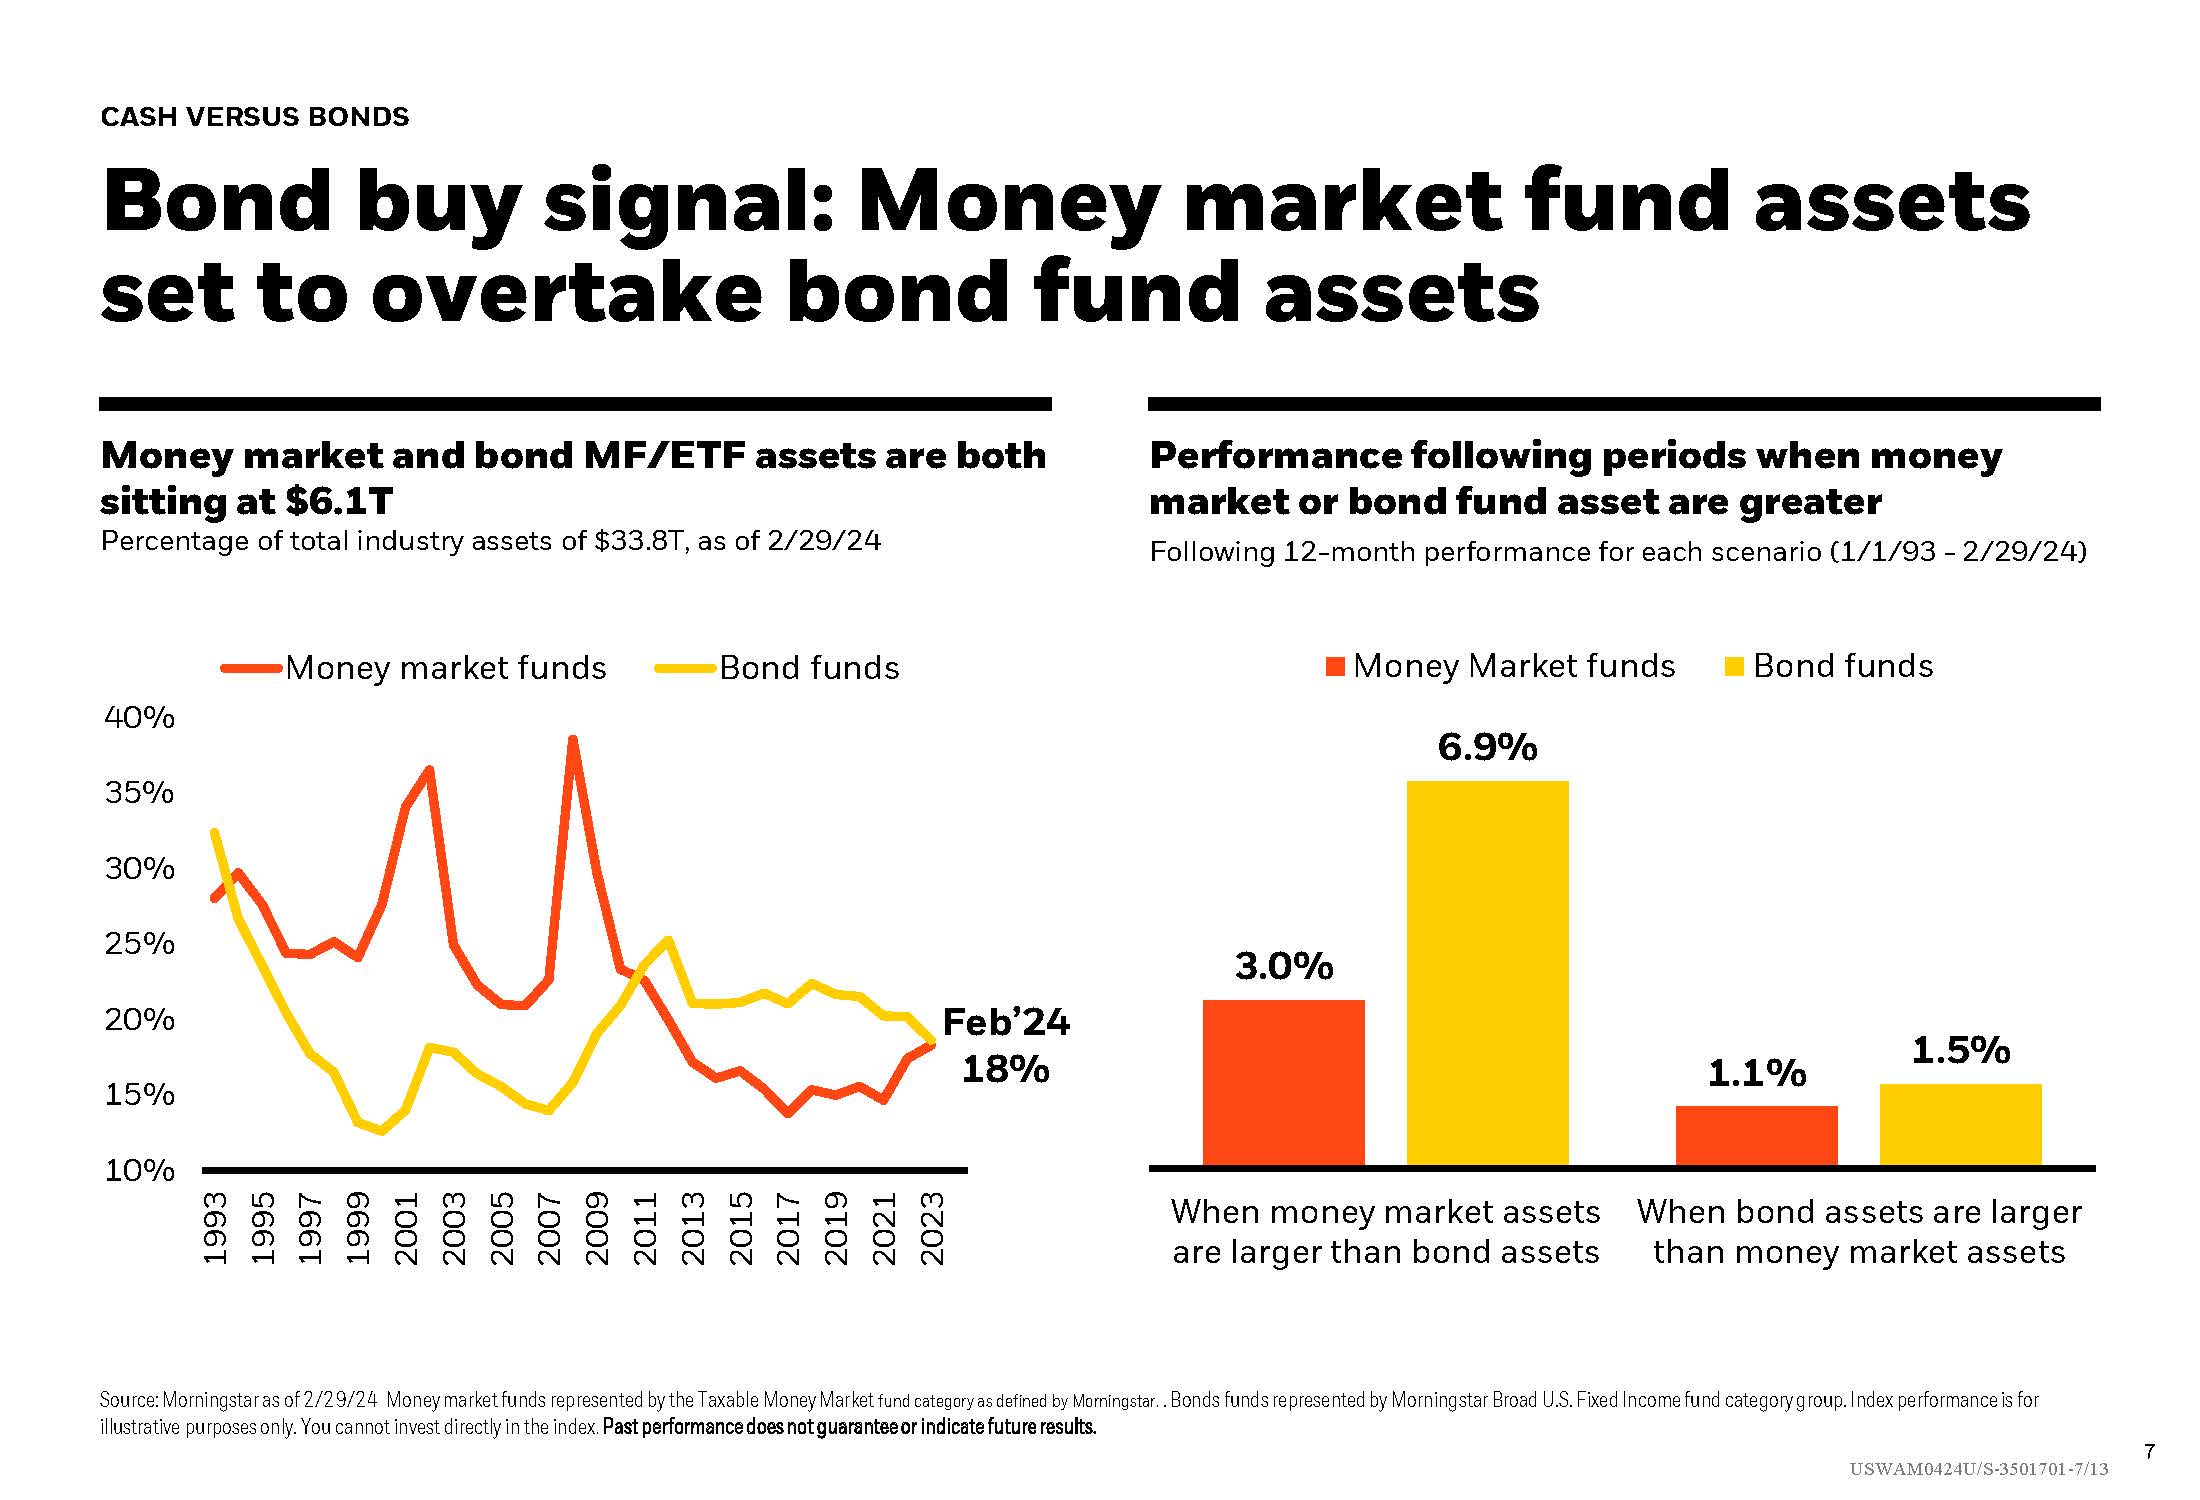
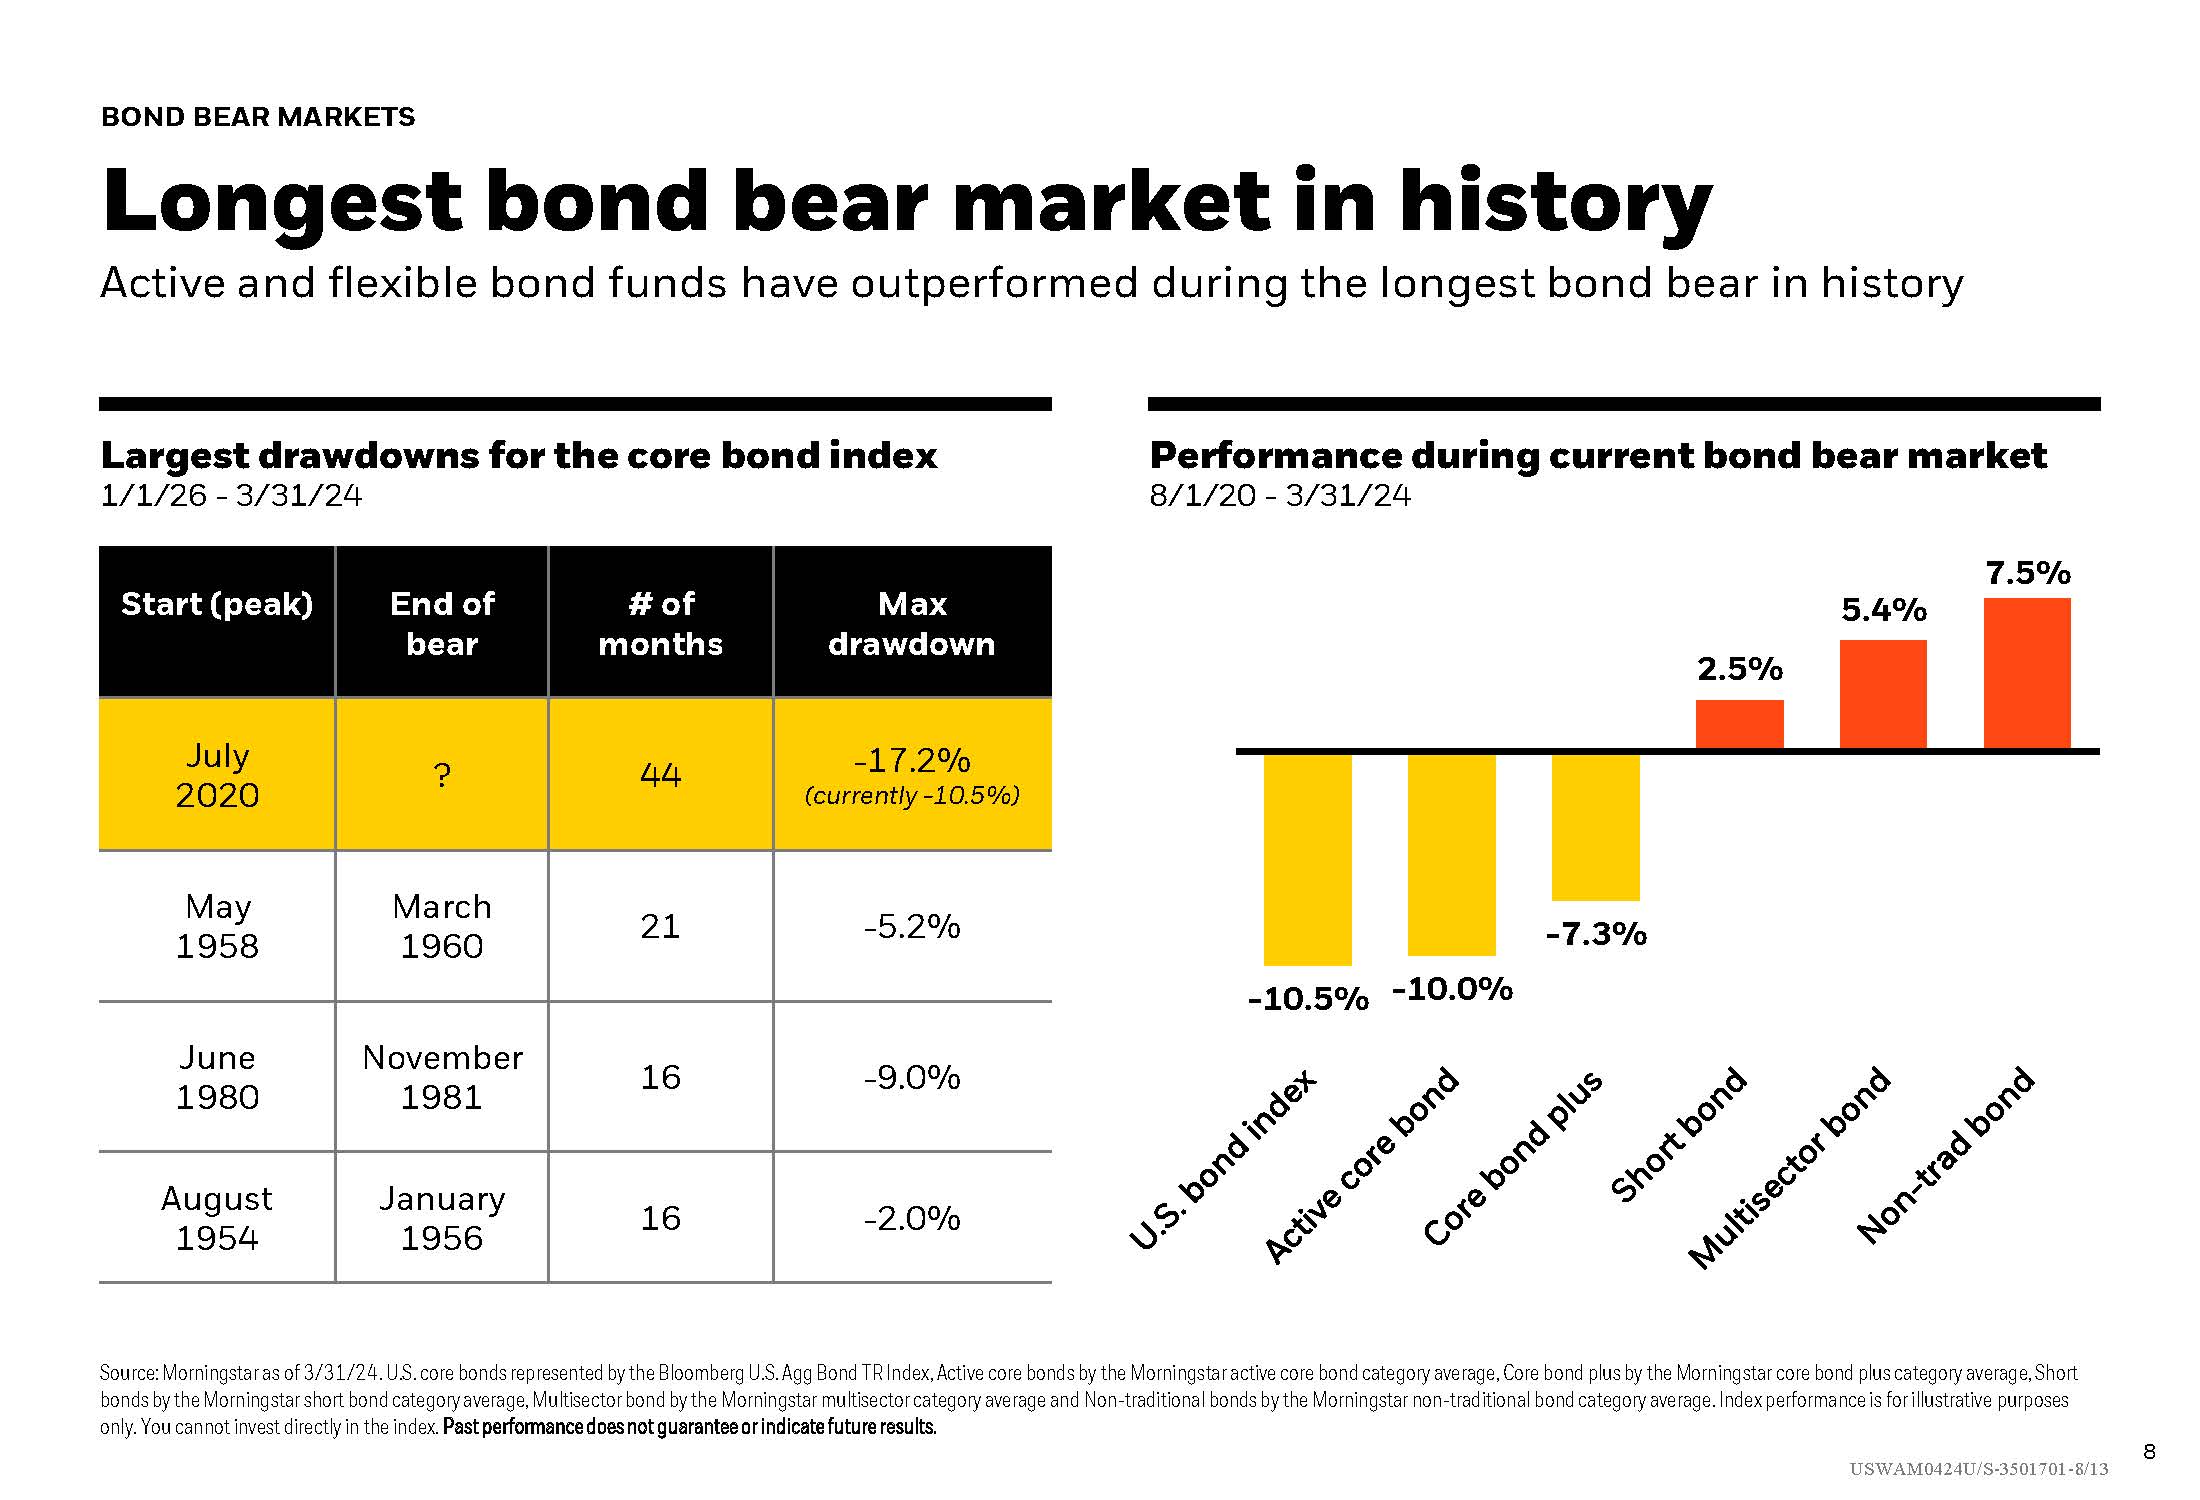
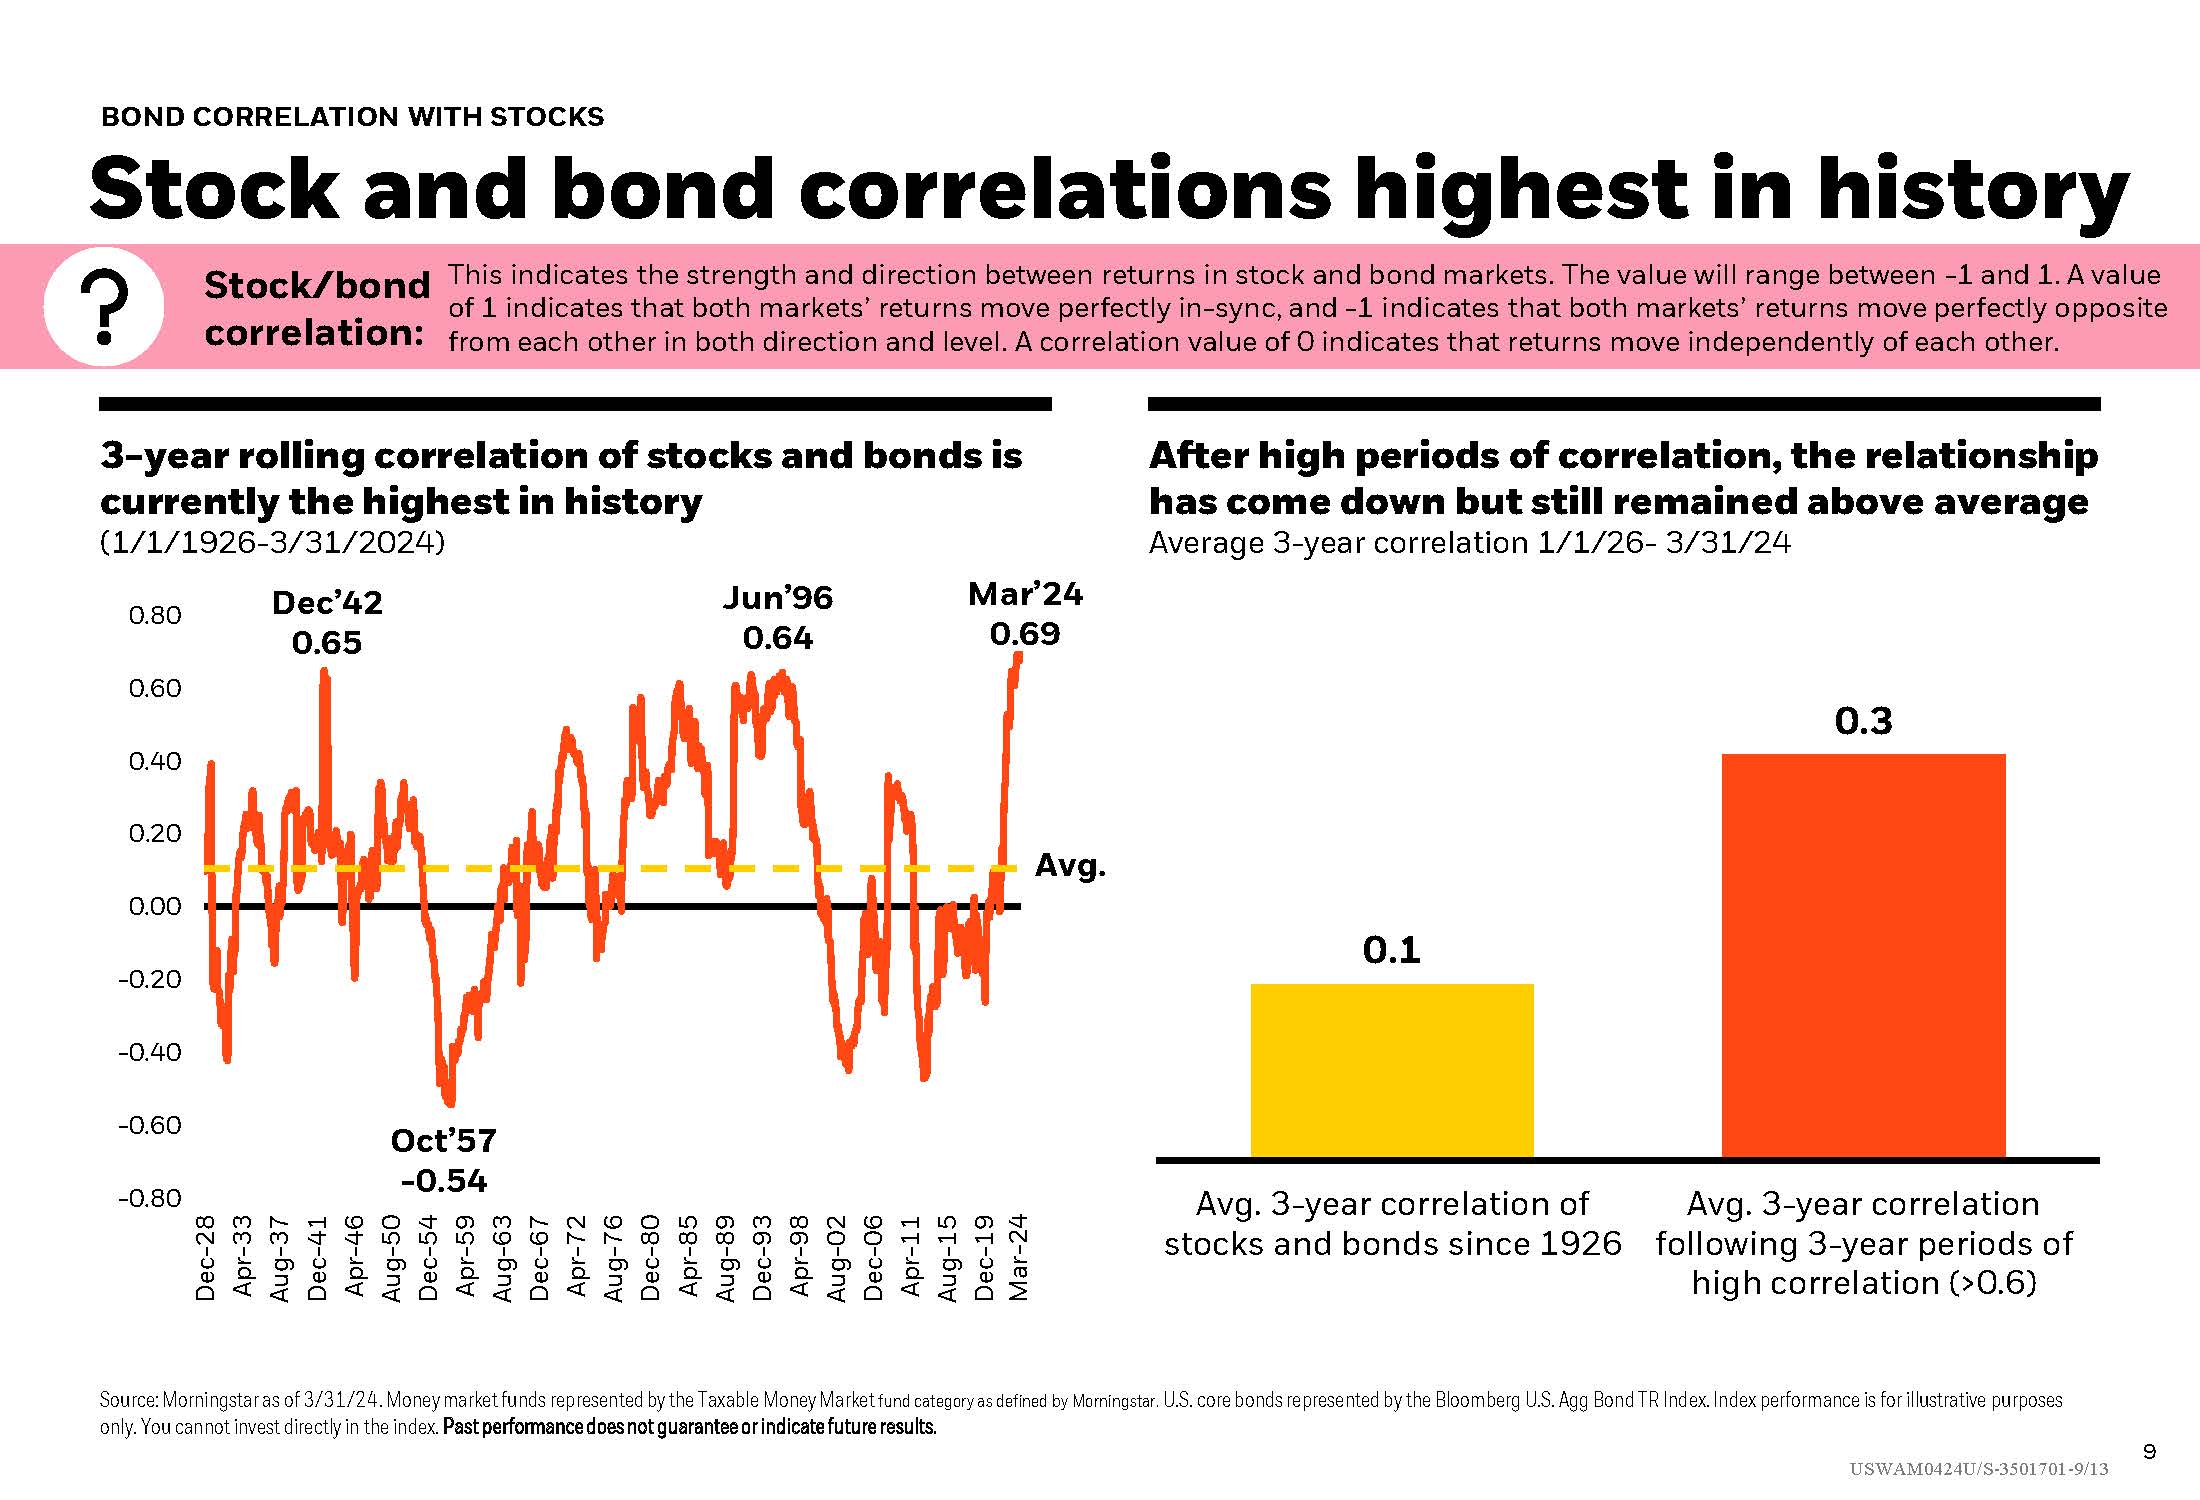
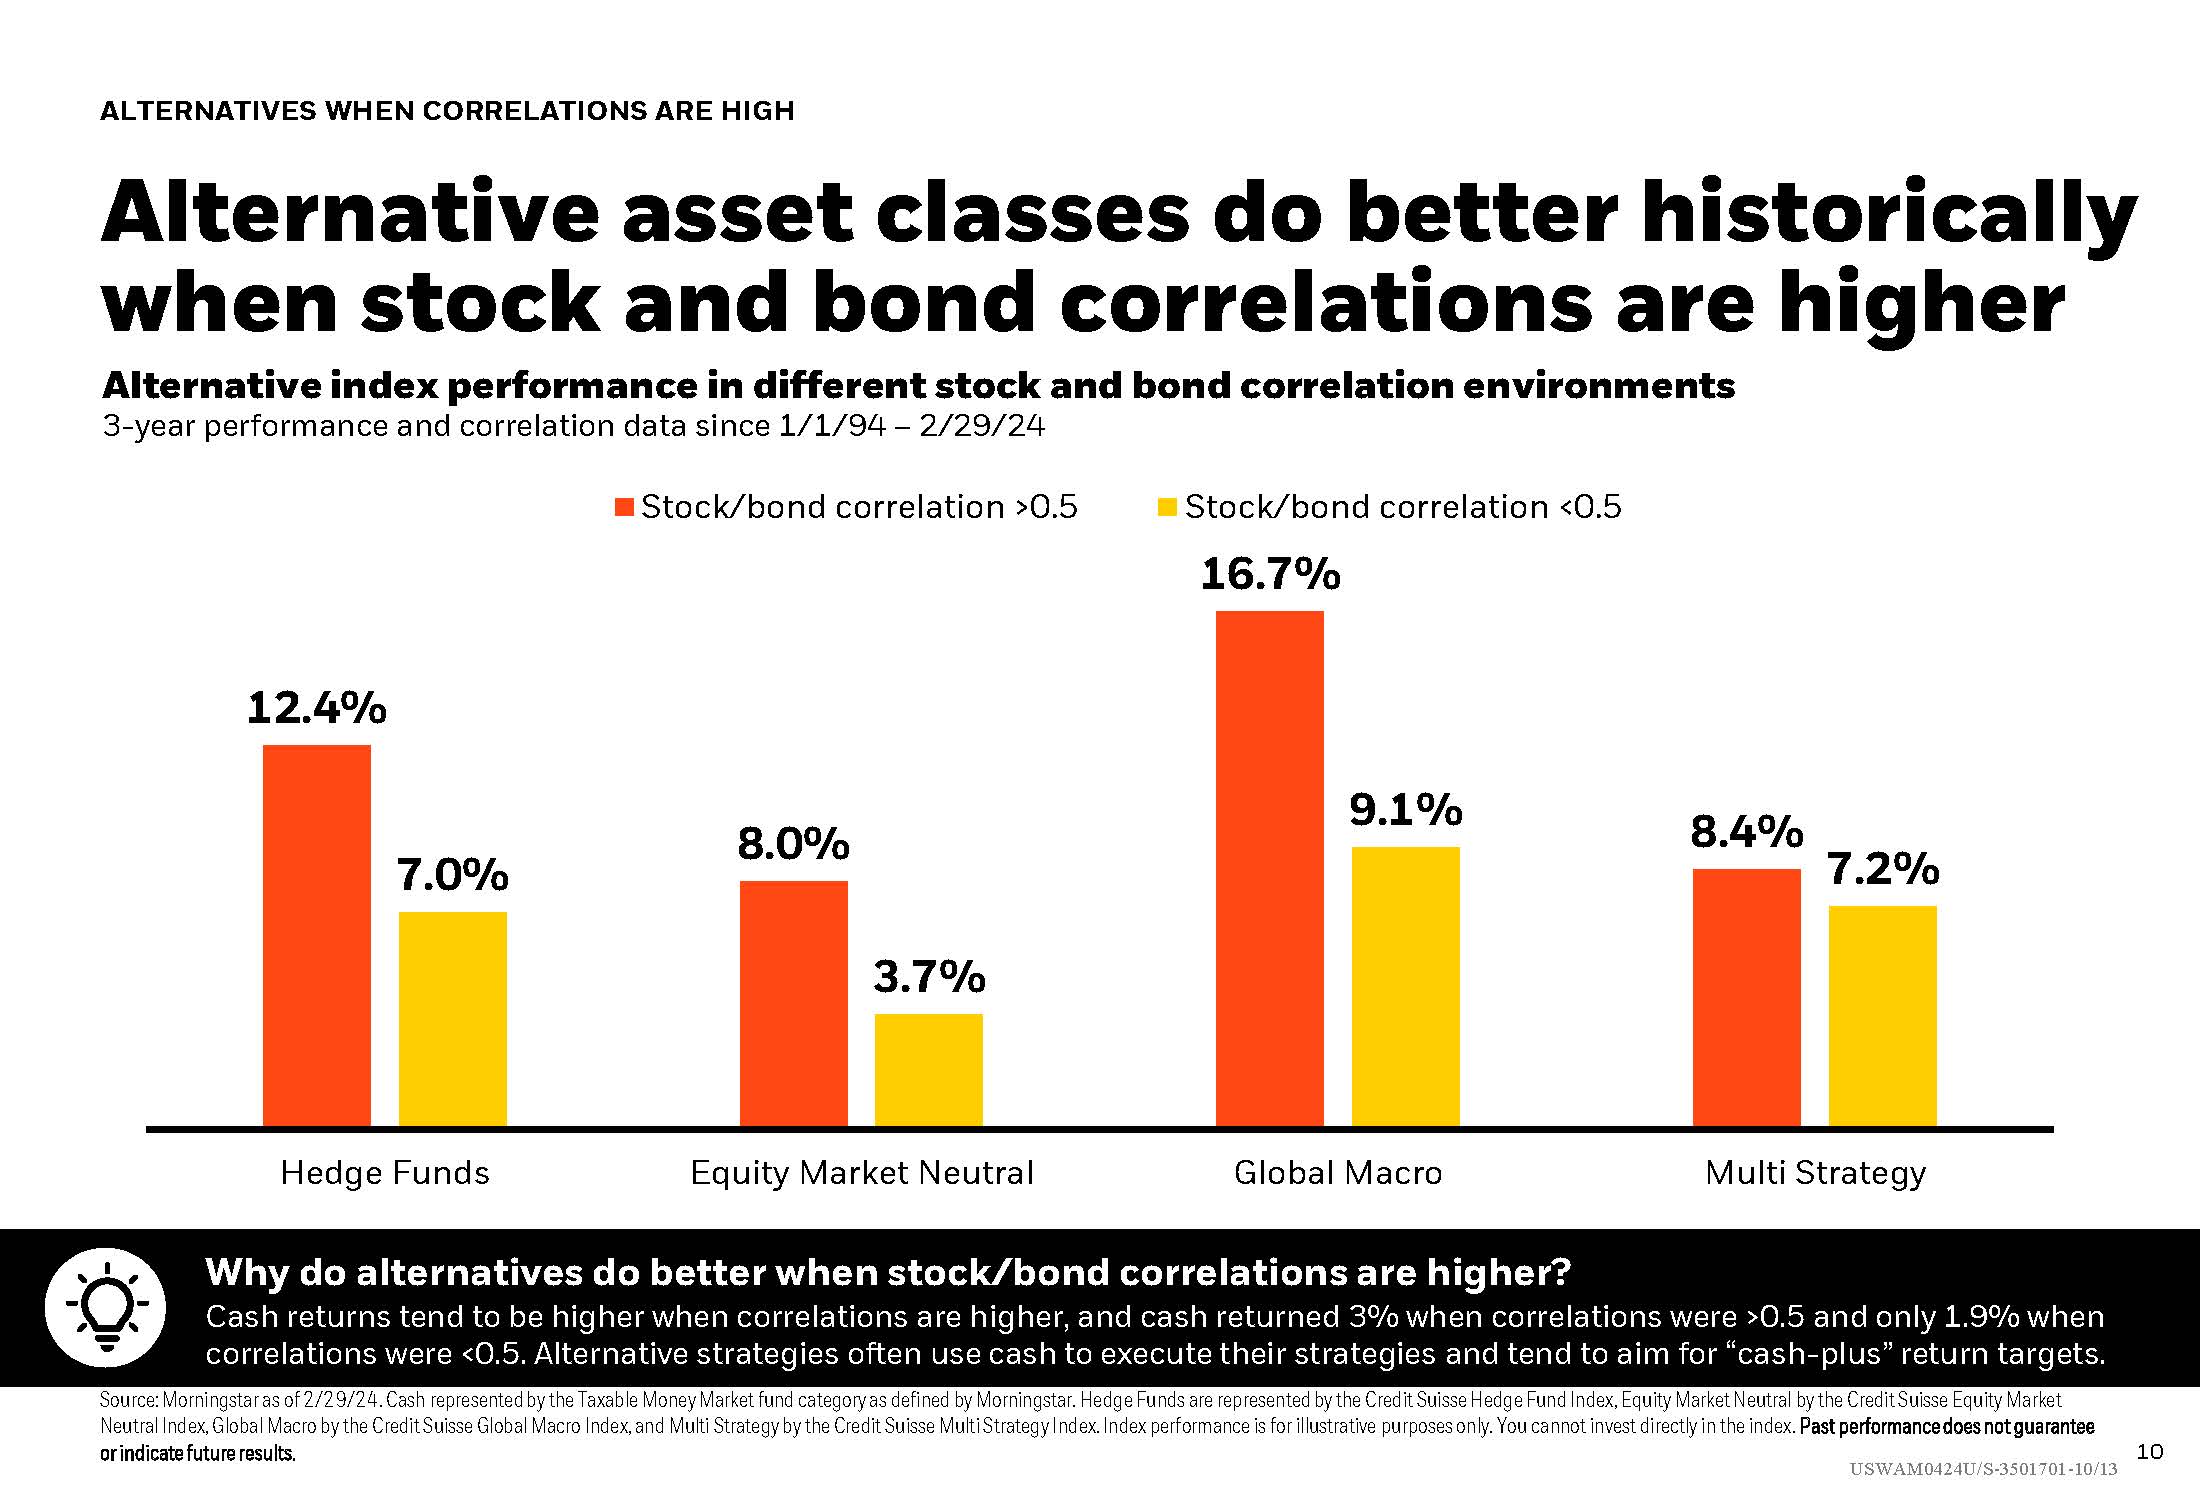
Despite the unusual performance in Q1 in which stocks started positive and bonds negative, this has been the longest bond bear market with active and flexible bond funds outperforming. See what that could mean for cash vs bonds with performance data following periods when money market or bond fund assets are greater. Also data for stock and bond correlations, trends in stock sectors by US Presidents, and charts on the 15th best start to a year for stocks.

April 29, 2024
Longest Bond Bear Market
Important Disclosure: Content on our website and in our newsletters is for informational purposes only. The information provided may (or may not) directly apply to your situation. We recommend that readers work directly with a professional advisor when making decisions in the context of their specific situation.

Other content you may like

  • NOV Student of the Market

    Turkey to Tax: Seasonal Stock Returns

    November 16, 2021
    Seasonal Stocks and Bond Market returns, with a focus on stocks by size and stock sectors can be found in this month’s Student of the Market. Is there a seasonal period of higher returns historically? A look at 2021 as one of the worst years ever for bonds. Plus income asset classes and a breakdown of food inflation over a 12 month period.
    Read this Article
  • JAN Monthly Market Matters

    A Sigh of Relief in the Market

    February 1, 2024
    Read this Article
  • What's Driving the Market

    Podcast Highlight - Cause and Effect: Inflation and Interest Rates

    March 6, 2023
    The team discusses Inflation and Interest Rates, looking at historical trends and how inflation is measured along with a closer look at the actual control the Feds have. They finish with a look at how this is affecting car loans and mortgages.
    Read this Article
  • Market Performance and a Recession Indicator

    Market Performance and a Recession Indicator

    December 1, 2022
    U.S. stocks historically average 10% per year but rarely do they finish a year at that level. See the difference between the average annual return and what happened to stocks YTD in 2022 by looking at the range of returns for stocks by the full calendar year. A quick glance at the most reliable recession indicator and how alternative asset classes do better when the return on “cash” is higher. Plus stats on market performance.
    Read this Article
  • The link you have selected is located on another server. The linked site contains information that has been created, published, maintained, or otherwise posted by institutions or organizations independent of this organization. We do not endorse, approve, certify, or control any linked websites, their sponsors, or any of their policies, activities, products, or services. We do not assume responsibility for the accuracy, completeness, or timeliness of the information contained therein. Visitors to any linked websites should not use or rely on the information contained therein until they have consulted with an independent financial professional. Please click “Continue to Link” to leave this website and proceed to the selected site.
    phone-handset